cat ~/articles/ai-predictions-graded-matchday-3.mdx
Comunio World Cup 2026 · Part 4Round three of the public scorecard: the AI learned to doubt again — and fumbled the one thing it was best at
Round three of grading my World Cup fantasy AI in public: it got its self-doubt back — the widest confidence gap of the group stage — while the quiet half that's actually winning me the league handed me a stranger problem. I went to grade it and couldn't trust my own scoreboard.
In the last article I ended on a worry, not a win. The system had nearly doubled how often it called the right winner of a game — and, in the same breath, gone blind to its own mistakes. Its confidence had flattened out: just as sure on the games it got wrong as on the ones it got right. I said the most useful number that round wasn’t the accuracy, it was that gap closing to zero — the system quietly telling me it had learned to win without learning to doubt. And I said you could watch round three land on the public page before taking a word of it on faith.
Round three is in. The group stage is over. The doubt came back — wider than in any round of the group stage. And in the same round, the quiet half of the system that’s actually winning me the league handed me a stranger problem: I went to grade it and found I couldn’t trust my own scoreboard.
Two things happened at once, pulling opposite ways, and the honest version of this round is both of them.
One thing to keep clear, because it’s the whole point of doing this in public: I’m not training an AI to predict football, and there’s no secret model being built here. I take existing models — the same ones any company can pick off the shelf — and give them the tools, the context and the instructions to do a specific job, then sharpen how they do it round to round. It’s closer to handing a sharp new analyst your data and a checklist than to building a new brain from scratch. You put a good one to work on your problem and keep a readable record of where it helps and where it hurts.
The headline, both halves of it
The good news, and it’s the number I most wanted to see: the system got its judgment back. A prediction here comes with a confidence figure — “I’m 70% sure of this.” After round two that figure had stopped meaning anything, because it was the same whether the call was right or wrong. In round three it started meaning something again — more than it ever has.
The bad news, in the same breath: the half I’ve called its real edge — figuring out who will actually walk onto the pitch — looked like it had its weakest round of the group stage. I say looked because, when I went to grade it, I caught my own scoreboard getting its facts wrong — and that turned out to be a more useful story than the score itself.
So it’s the most interesting round yet: one half of the system got measurably better, and on the other I found I couldn’t trust my own measurement.
The recap, in case you’re new here
Because the whole point of this series is that you can check me, here’s the setup in one breath.
I’m running a team in a fantasy World Cup, and a squad of AI agents does the daily homework. Every matchday they predict two different things: who will actually start each game, and how each game will end. Then reality grades both, out loud, and I write up the marks — the misses louder than the hits. The group stage was three rounds. This is the third and last, so for the first time we can see the whole arc.
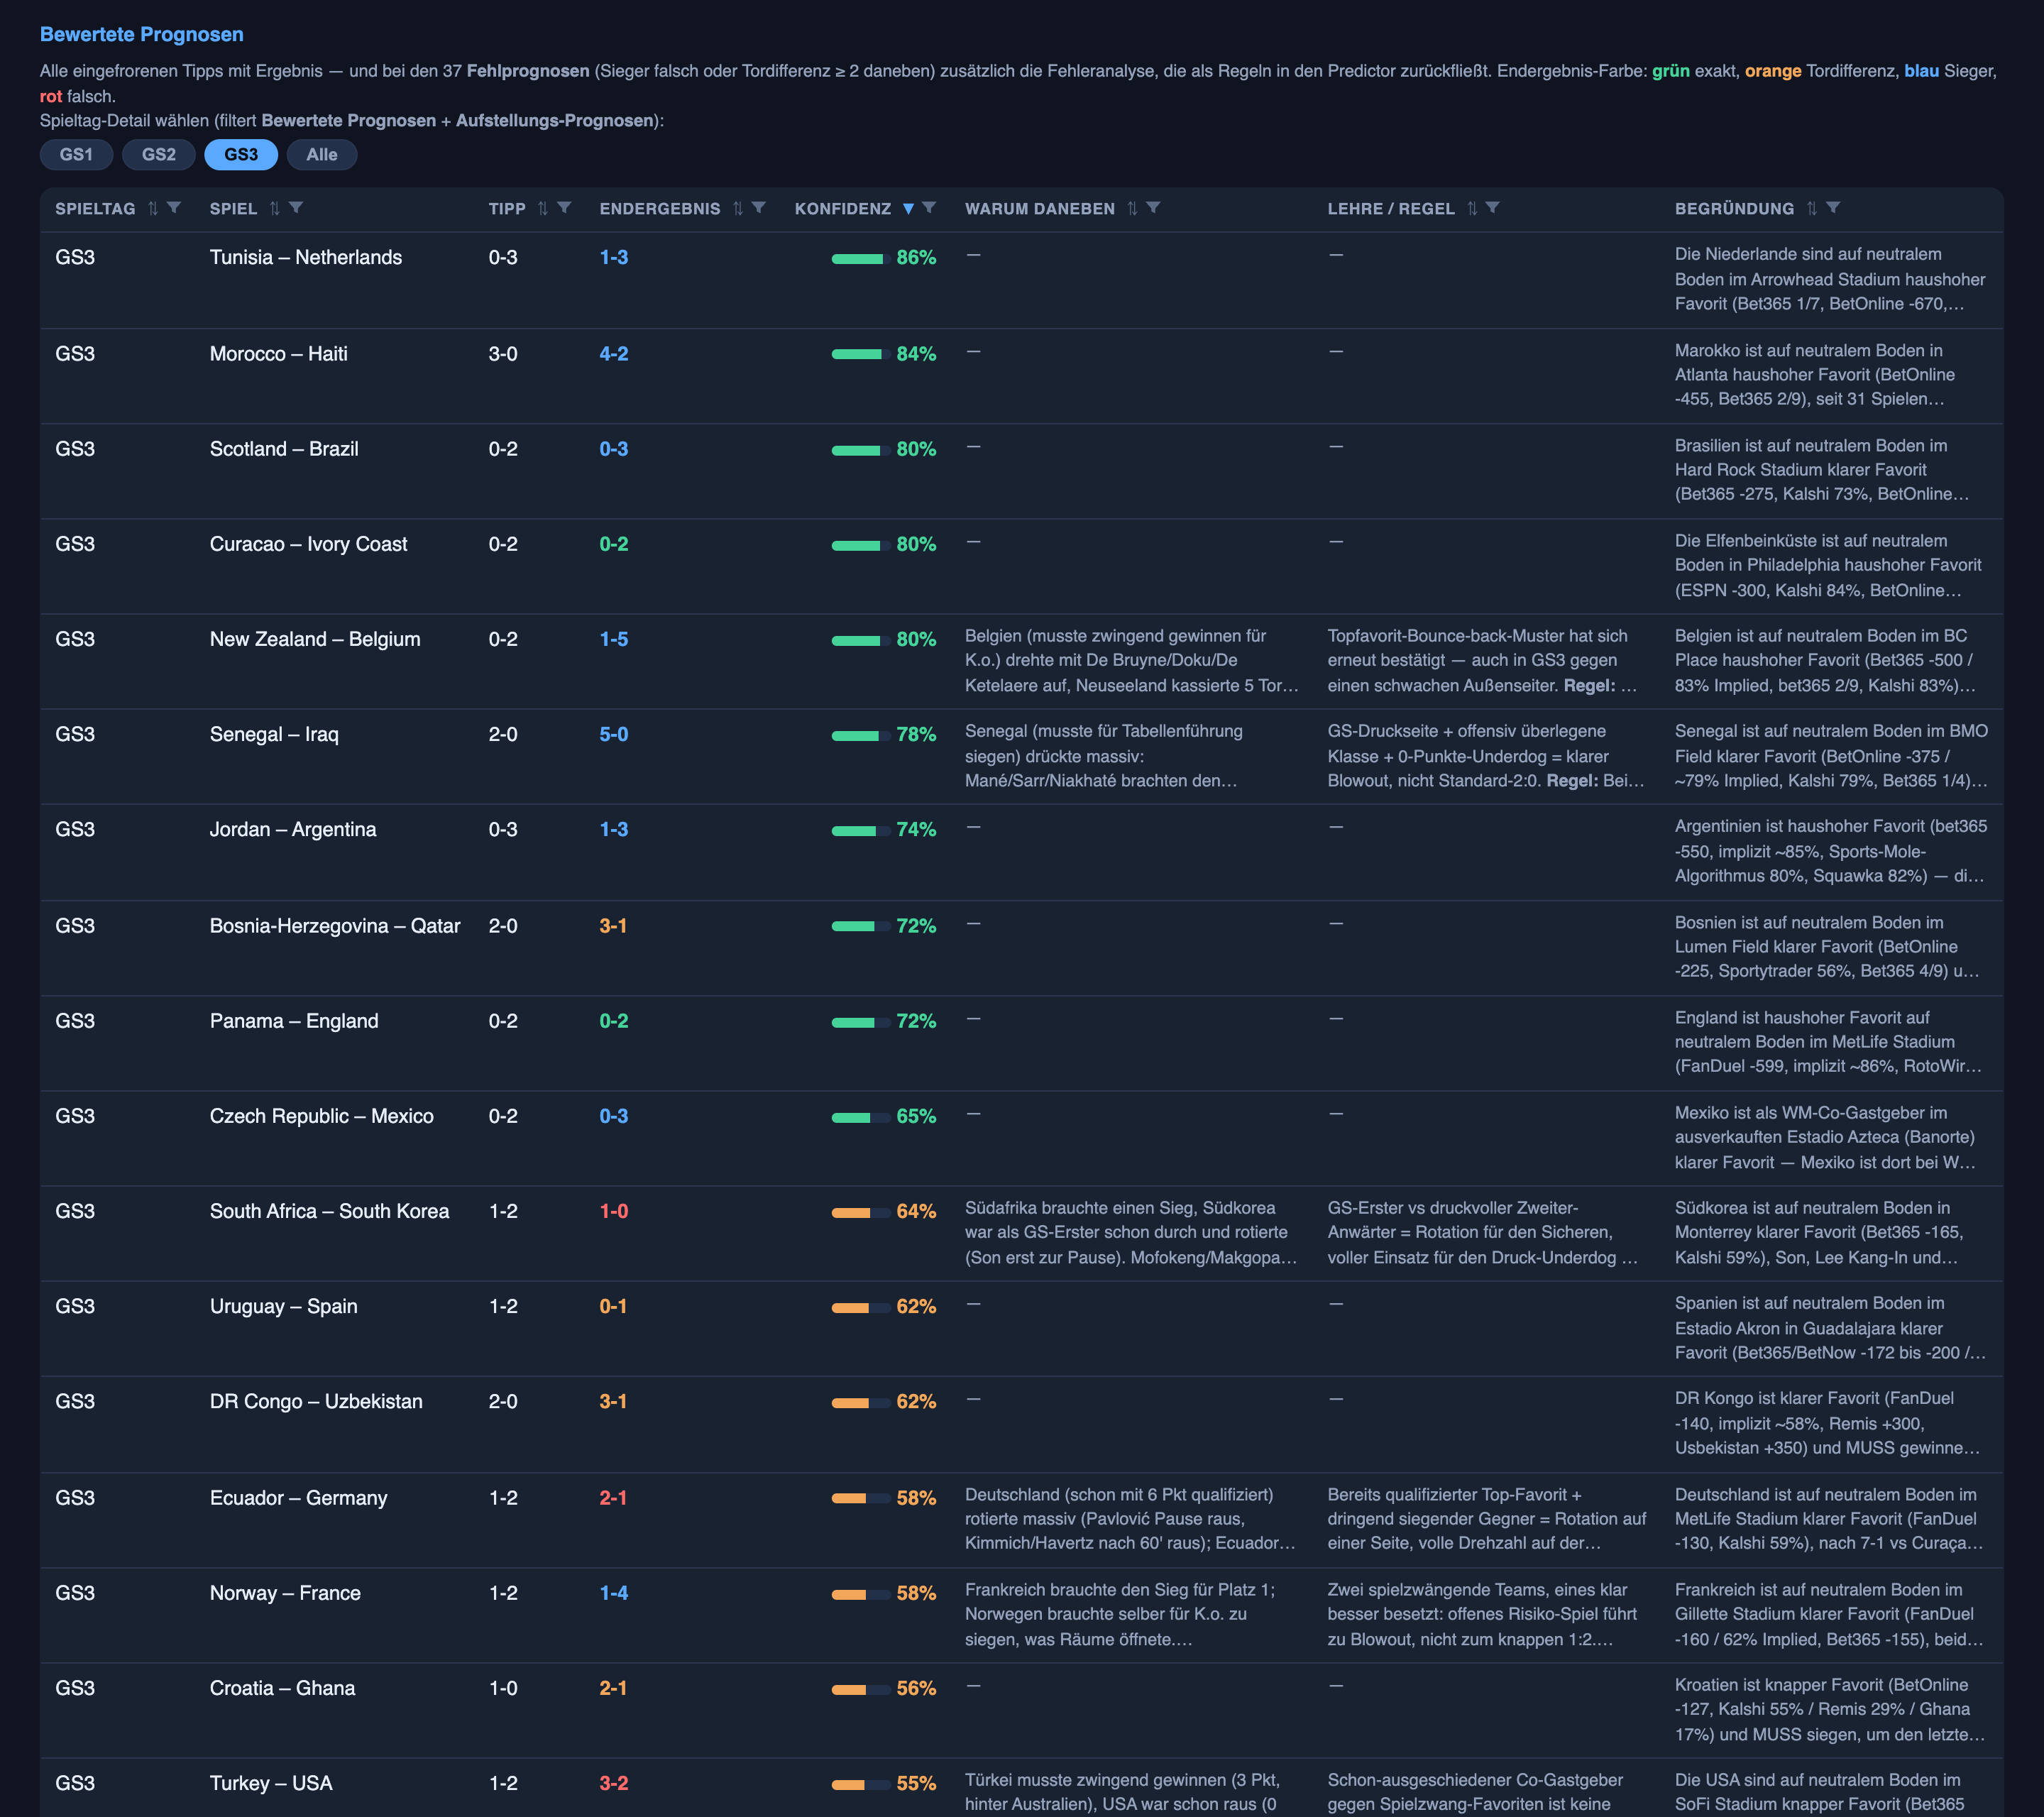
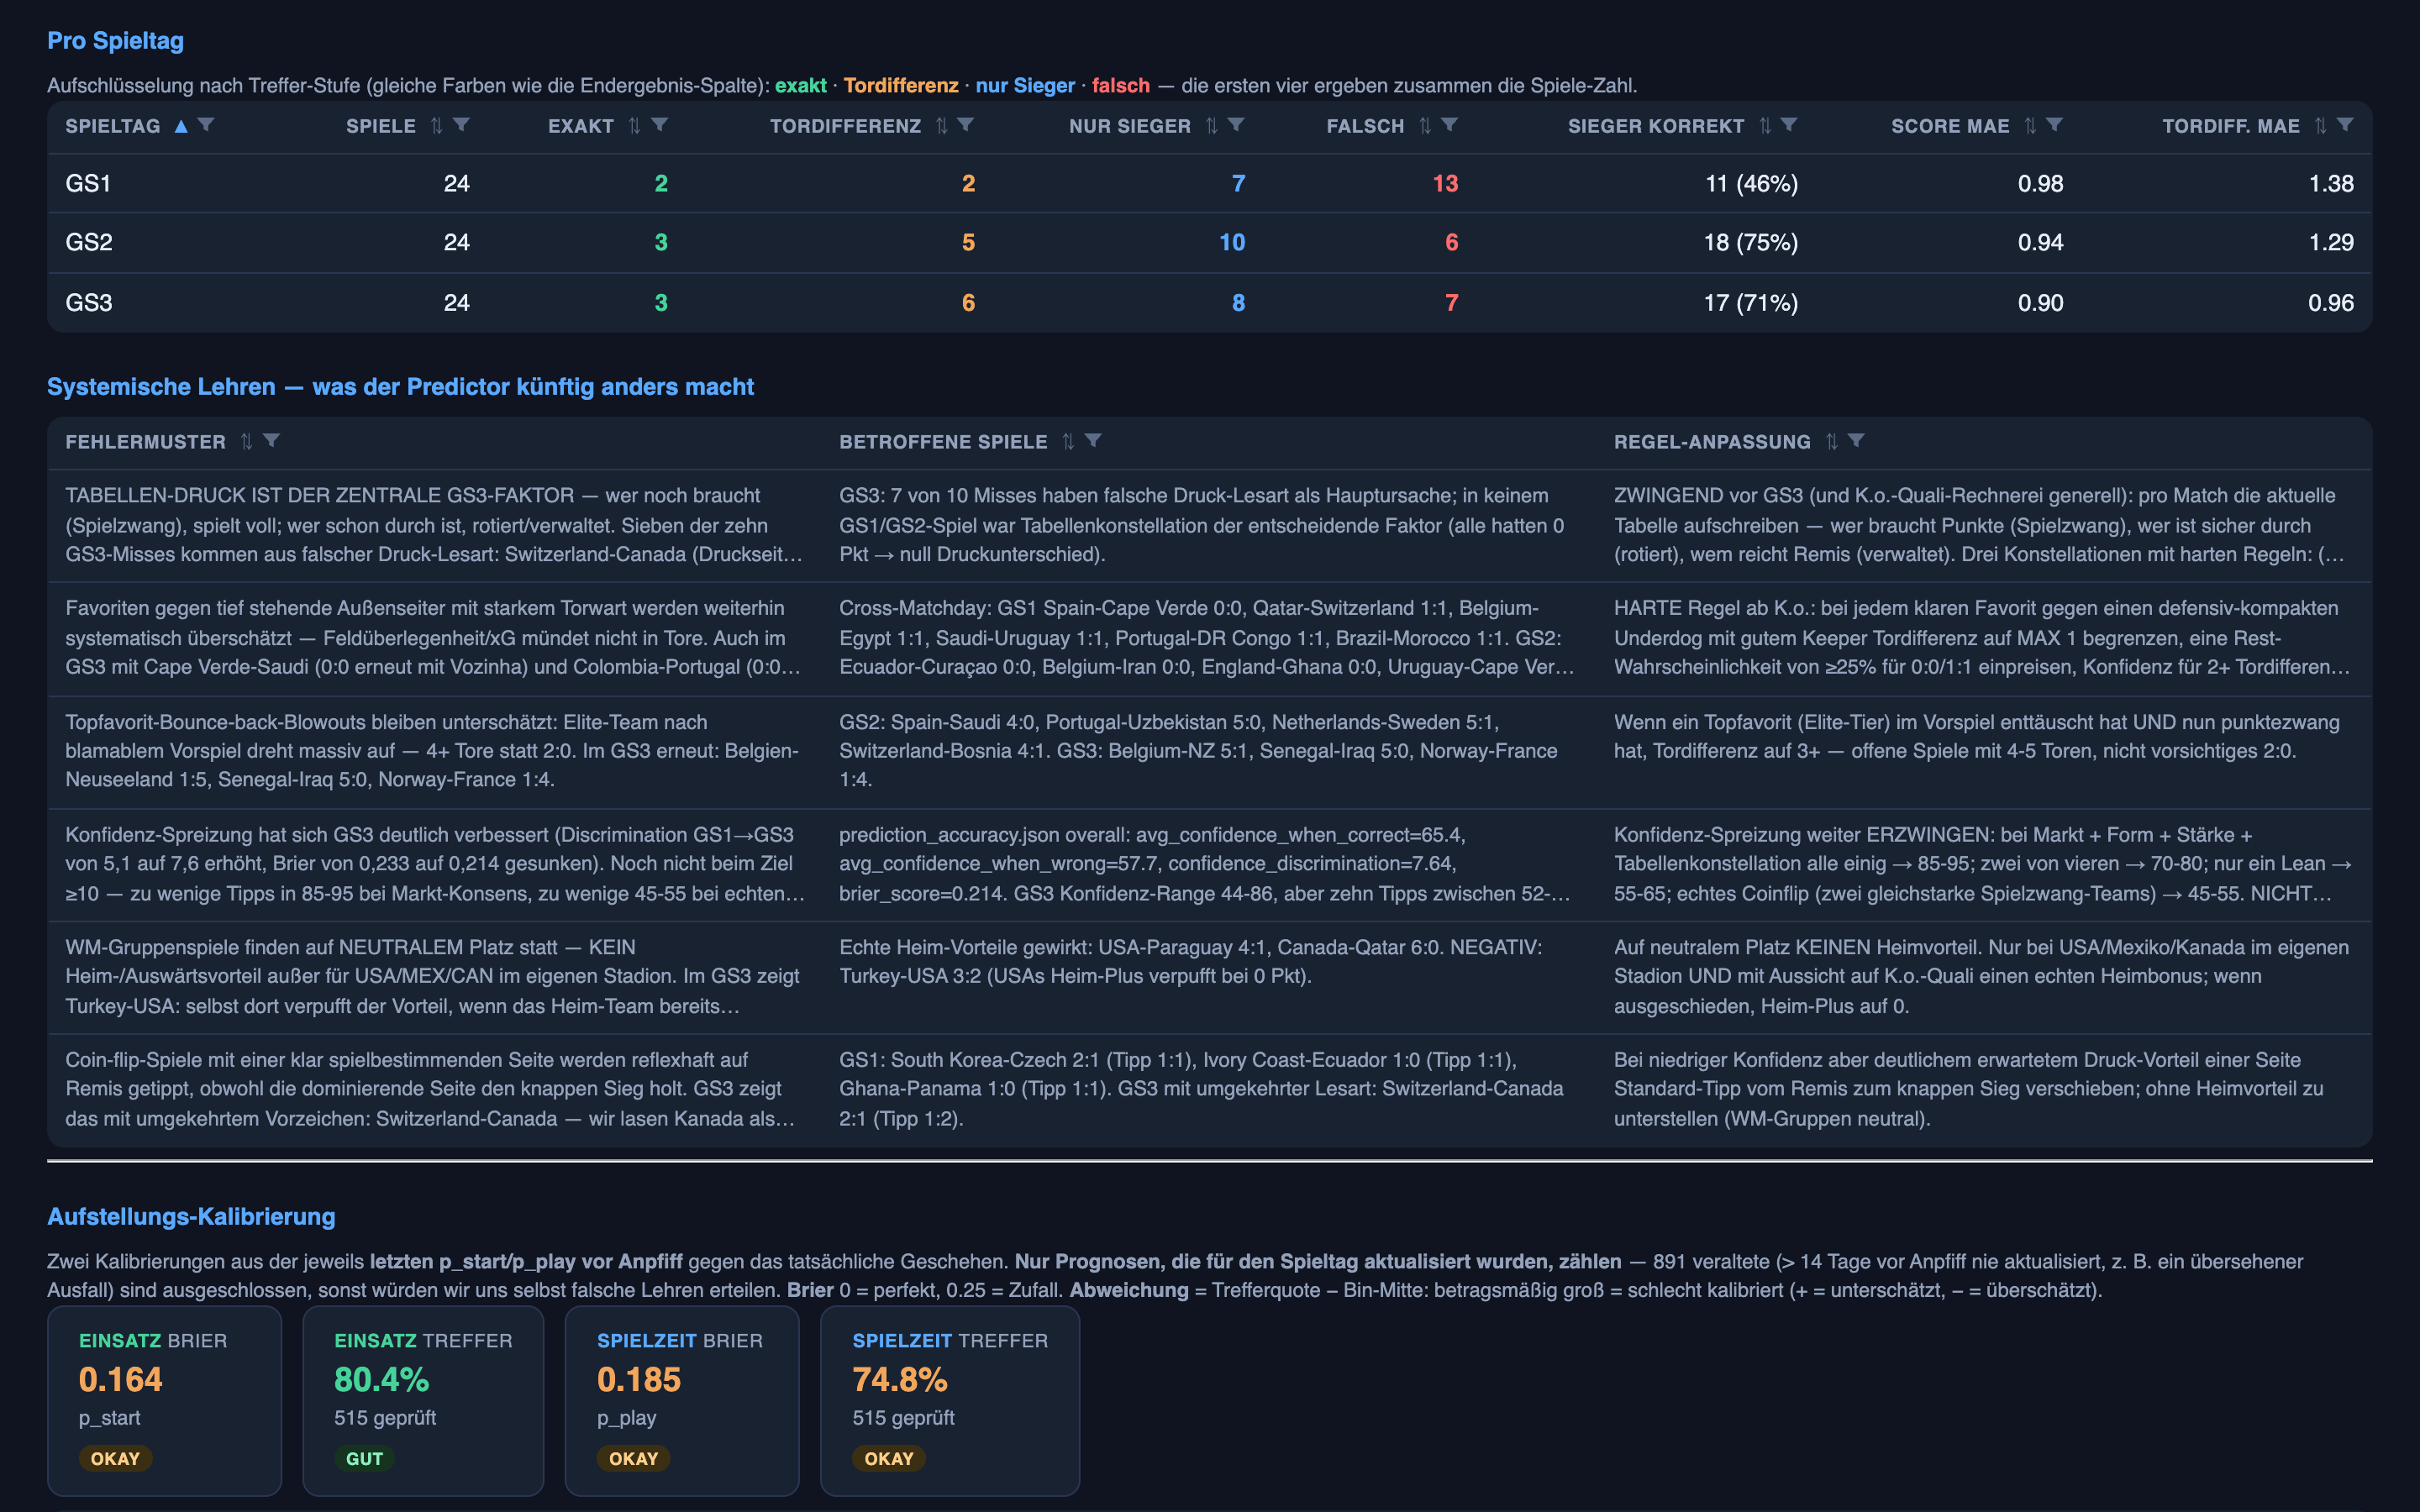
On the headline question — did it pick the right winner — that arc reads: 11 of 24 games right (46%), then 18 of 24 (75%), then 17 of 24 (71%). The big jump in round two held. It didn’t melt back to where it started. (A fair caveat that runs through this whole piece: each round is twenty-four games, so a single round’s swing is a small sample — I’m reading the trend across three of them, not betting the house on any one.)
But picking winners was never the hard part of this story. The hard part was the two things underneath it: does the system know when it’s about to be wrong, and can it tell who’s going to play? One of those got dramatically better this round. The other got worse.
The doubt came back — and this is the number of the round
Start with the one I was waiting on. In plain terms first, before the numbers: the system got roughly twice as good at knowing which of its own calls to trust.
Here’s the gap between how sure the system was on its right calls and its wrong ones, round by round — a number I pull out of the raw prediction-and-result logs myself, because the summary page blends all three rounds into one figure and hides the story:
- Round one: about 65% sure on the games it got right, 57% on the ones it got wrong — a gap of roughly eight points.
- Round two: 64% and 64%. The gap collapsed to essentially zero. That was the alarm.
- Round three: about 67% sure when right, 54% when wrong — a gap of thirteen points. The widest of the whole group stage.
Read that against round two and it’s a genuine turnaround. The system got more confident on the calls it nailed and pulled its confidence down on the ones it flubbed. One more sign it isn’t a fluke: every call it made at 70% confidence or higher this round came in right — nine of them, all correct. Nine is a small sample, so I won’t oversell it, but not one of the loud calls missed.
And the why is boringly mechanical, which is what makes it trustworthy. The fix is visible in the predictions themselves. In round two the system tipped three games by two goals or more that finished level — Ecuador “winning” 3–0 over Curaçao, at 86% confidence; it ended 0–0. Confident, and wrong, on a favourite that couldn’t break down a packed defence — the worst failure a forecaster has, because it doesn’t feel like a guess, it feels like knowledge. In round three it tipped none. It started pricing in the draw and capping the favourite’s margin, and that single discipline — get quiet when the game is a coin-flip — is what dragged the confidence back into meaning something.
The system has since written that lesson into an explicit target for the knockouts: keep the confidence gap above ten. Round three already cleared it — thirteen against a bar of ten. I can point at that in the numbers rather than ask you to trust the vibe.
The margin got better too — but not for the reason it looks like
There’s a second number that improved, and it’s worth being honest about, because the honest version is more interesting than the flattering one.
Round after round I’d flagged that the system was bad at the size of a win — it would tip a polite 2–0 on games that finished 5–0. Its average error on the goal difference had been stuck around one-and-a-third goals (the goal difference just being how many goals apart the final score was). In round three it dropped to under one. On paper, the weak spot fixed itself.
Except it didn’t, quite. I went and checked where that improvement came from, and it isn’t the thing you’d assume. The system did not get braver about calling routs — when a game genuinely turned into a hammering, it still under-tipped it by nearly two goals, the same pattern as the earlier rounds (it tipped Senegal 2–0 over Iraq; it finished 5–0). What actually happened is duller: round three simply had fewer blow-outs than round two did, and the real gain was that draw discipline again — by stopping its confident-but-wrong two-goal calls on tight games, it erased a whole category of big errors. The margin score got better because the system stopped being wrong in one specific way, not because it got right in a new one.
I’m spelling that out because it’s the kind of thing a dashboard will happily let you misread. A metric moved in the right direction; the tempting story is “we fixed the margins.” The true story is “we fixed the draws, and the schedule was kinder.” If I let the first story stand, I’d be trusting my own scoreboard without reading it — which is the exact failure this whole series is about.
The other half — where the scoreboard broke before the model could
Now the other direction, and it turned into a stranger story than I sat down to write.
The system has two jobs. Calling the result is the flashy one — the public scorecard. But calling who actually starts is the quiet one, and I’ve been blunt that it’s the quiet one that’s winning me the league. In every previous round it was the strong half: right about who’d be in the eleven roughly five times out of six.
By its own scorecard, that half had its weakest round of the group stage — and it slipped in a way that should have stung, because I’d stood on this exact page one round earlier and predicted it would. But should have is the operative phrase, because when I went to grade it properly, the grade came apart in my hands.
Here’s what I’d called, out loud, at the end of the last article. Several teams had already won both their opening games and walked into the final round with nothing left to chase — and a coach in that spot rests his best legs for the games that count. My prediction: round three would punish anyone trusting a star’s name over the day’s actual team sheet, and I said the system now treated a runaway leader as a rotation flag.
The system’s scorecard duly reported the who-starts half slipping to its worst round — clean forecast, apparently landed. So I went to pull the receipts: the concrete “look, it rated this man a lock and he sat” examples that make a claim real. The story came apart as I checked it.
The first example I reached for was a player the system had logged as a no-show — one I’d watched play the whole game. Its own record of who took the field was simply wrong. The next was a genuine absence, but an injury, not the dead-rubber rest I’d forecast; his coach didn’t drop him, his hamstring did. Two of my best examples, and neither one actually held up the story I was about to tell you.
So here’s the honest verdict, and it’s less flattering than a tidy “I called it”: I can’t grade the rotation forecast this round, because I can’t trust the scoreboard I’d grade it with. The who-starts number dipped, yes — but some of that dip is the system marking its own correct calls as misses, logging players as benched who actually started, and some is ordinary injuries I’d have mistaken for tactical rotation if I hadn’t checked each one by hand. The forecast might well be right. I genuinely don’t know, because the record underneath the grade isn’t clean enough to say.
And that — not the dip — is the finding worth your time. I came into this round ready to tell you the who-starts model had got worse. What I learned instead is that my own scoreboard couldn’t be trusted to tell me whether it had. That is the exact question this whole series keeps circling — can I trust my own metrics? — and this round, for this half, the answer was no. The only reason I know it’s no is that I read the story behind each number instead of taking the summary at its word; the summary looked clean. So the fix here isn’t a cleverer model. It’s the dullest work there is: get the record of who actually played right, before I let it grade anything. Until then, the rotation forecast stays open — ungraded, on purpose.
Grading the other bet: the market repriced overnight
The last article made a second call, about money rather than football, and this one the system got right — sharply.
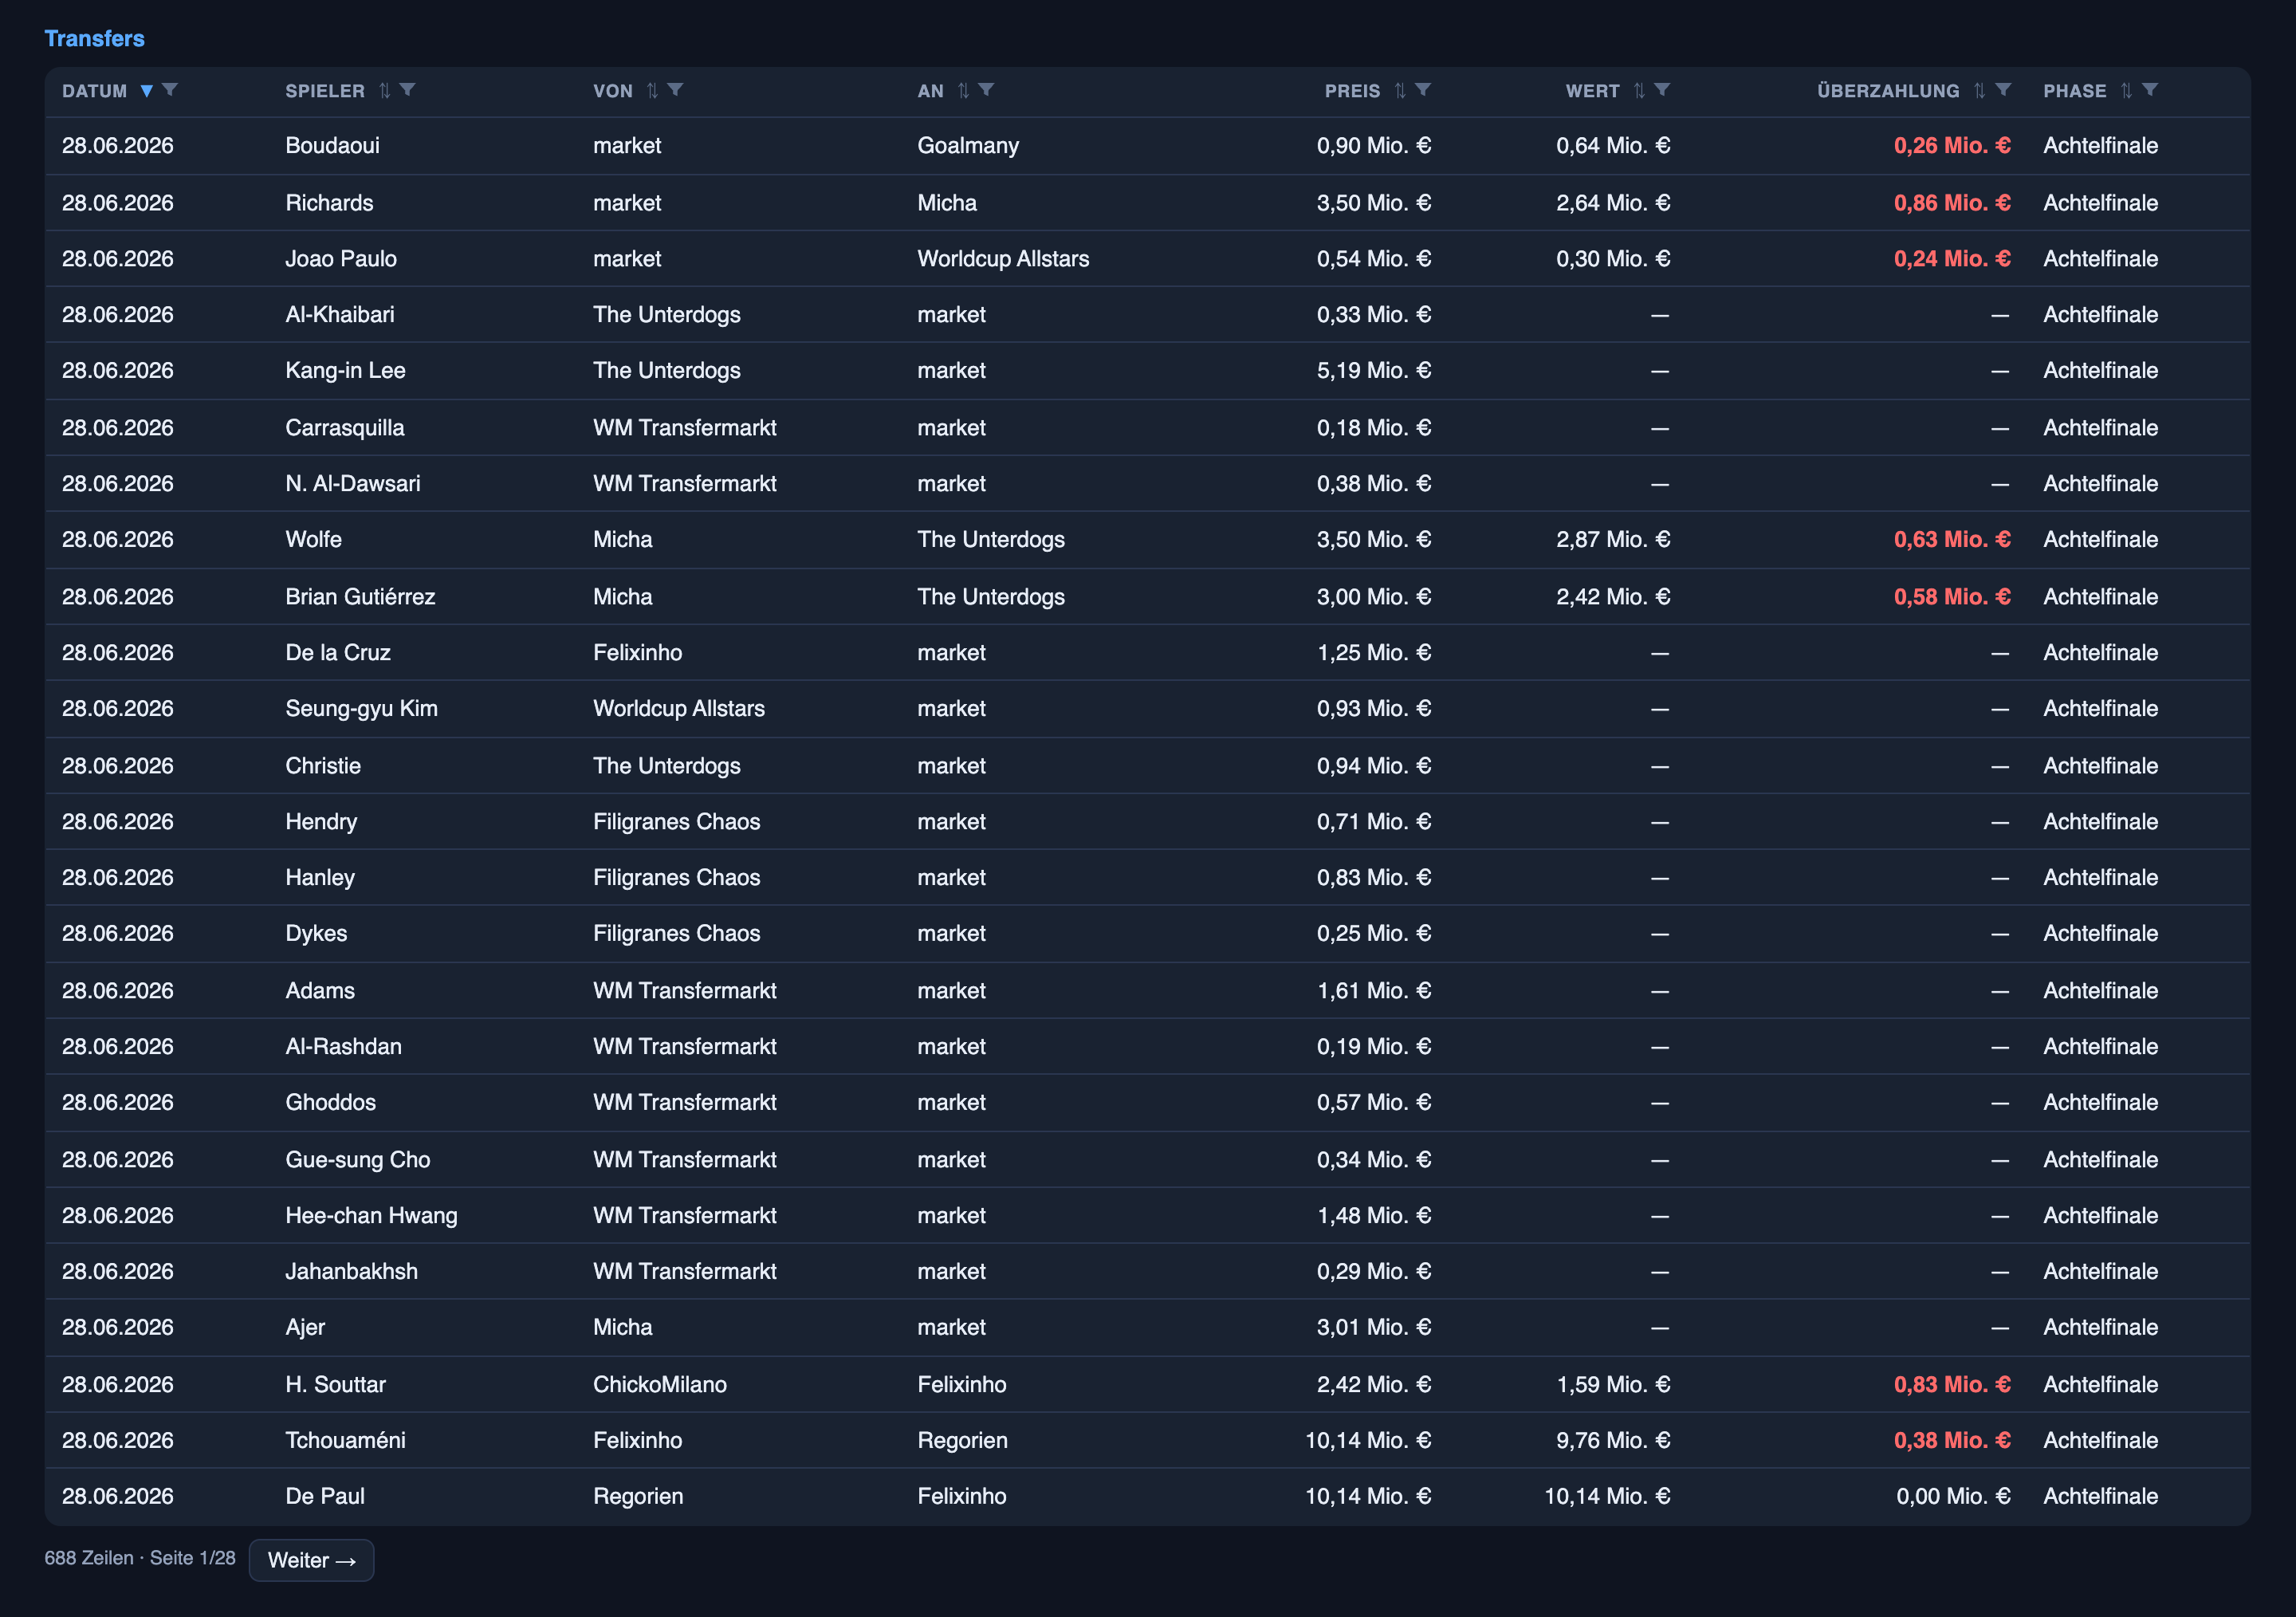
The setup: once the group stage ends, a third of the teams go home, and the knockouts begin — where the surviving players are worth far more, because a point scored in the rounds that count doubles toward the finish. I predicted a two-sided stampede on the transfer market the moment the group stage closed. On one side, a fire-sale of players from knocked-out nations — dead weight nobody wants to hold. On the other, a bidding rush for the reliable starters of the genuine contenders. And the whole thing should move faster the instant the bracket became real.
It played out almost to the day. Transfer activity had been cooling all through the group stage — down to its slowest, about ten moves a day. The moment the group stage ended, it doubled, back near its pre-tournament frenzy. The day after the final group games was the busiest day since the season opened, and it was a liquidation: sixteen players from eliminated nations dumped onto the market, almost none bought. Across the whole knockout window since, all seventeen transfers involving an eliminated-nation player have been sales — the losers are being cleared out, not picked up.
And the other side showed up right behind it. Once managers had cash from the fire-sale, they spent it on contenders, and the overpaying got worse. Through the group stage, the typical winning bid came in around a tenth over a player’s market value. The instant the knockouts started, that jumped to thirty percent over — and every one of the roughly fifty knockout purchases so far has been a player from a team still alive. People paid up, hard, for survivors.
I’ll take the honesty tax on this one, though, because I got a detail wrong. I’d guessed the overpaying would be worst at the top — the marquee names. It wasn’t. Measured as a percentage over market value, the wildest overbidding was on the cheap and mid-priced players, not the expensive ones. The stars cost the most in absolute money, so it feels like that’s where the madness is; but the biggest percentage premiums were managers scrambling for affordable starters. Called the stampede, missed which end of the field it was worst on.
The standings, and the reason to stay nervous
So where does all of this leave the actual team? In front — further in front than before.
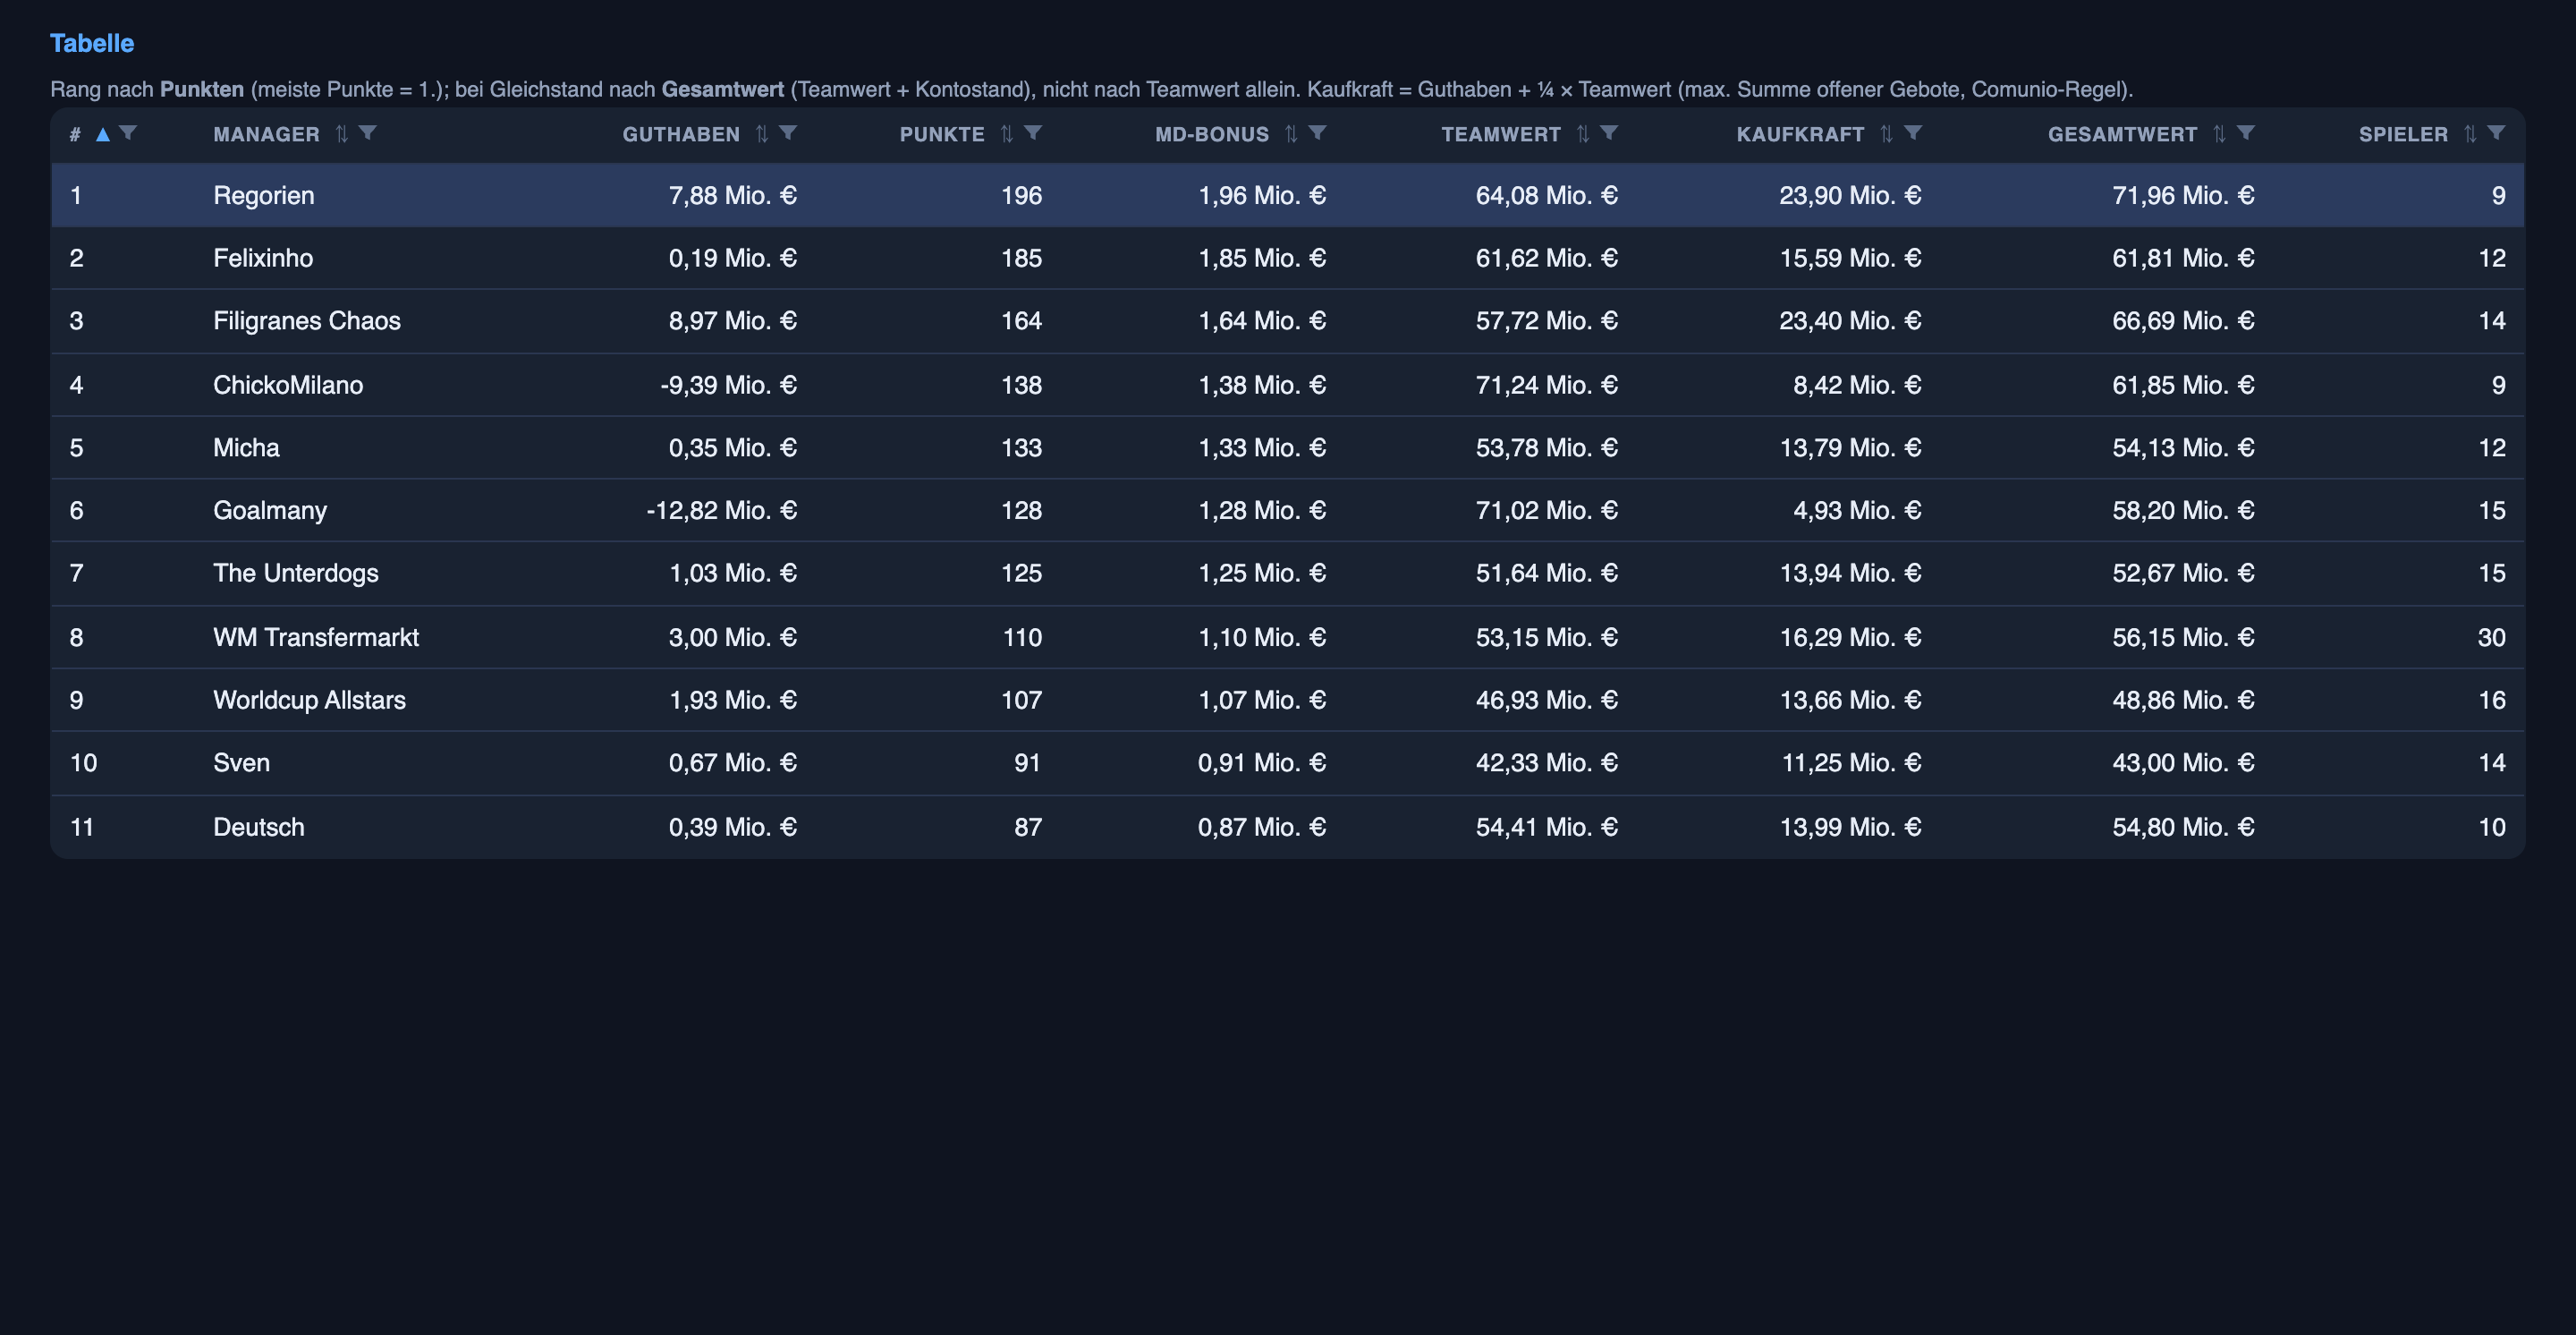
I’m first, on 196 points, eleven clear of second, and the most valuable squad in the league by around five million, counting players and cash together. The lead grew this round.
But here’s the reason I’m not relaxed, and it’s the whole tension of this round in one sentence: the edge that built this lead is the who-starts model — the exact half whose scoreboard I just told you I couldn’t trust this round. The lead isn’t coming from the flashy result predictions; it’s coming from the quiet research that lets me buy nailed-on starters cheap and bid sharply instead of overpaying. If the gauge on that engine has gone unreliable, I don’t get to feel relaxed about it — not with the stakes climbing and the market turning cut-throat. A system can be winning while you’ve half lost sight of whether it’s still working, and pretending otherwise is how comfortable leads evaporate.
Going into the knockouts I’m carrying a thin squad of nine — Messi, Bellingham, Tchouaméni, a core I’d rather keep than trade. Thin because of a mistake that’s mine, not the model’s: at the group stage’s end I sold down, clearing out players from nations I’d quietly bet against, certain they were on their way home. Some of those calls curdled within days. I sold off an Ecuador player expecting a tidy exit; Ecuador turned round and beat Germany. So I go into the double-or-nothing rounds a starter light, having just relearned the oldest lesson in this whole series — that the confident calls, mine as much as the machine’s, are exactly the ones that deserve a second look. That’s the posture now: hold the core, cover the gap, and get my own scoreboard honest before I trust it to grade anything again.
Strip the football out
Read this round again and delete the word “football.” What’s left is a set of things that happen to every system you’d trust with a real decision.
A model got measurably better at its headline job and quietly worse at the thing that was actually paying off — and a single dashboard number would have hidden the trade entirely. The metric I cared about most wasn’t accuracy at all; it was whether the system had its self-doubt back — whether its confidence tracked reality or had gone flat. A model that’s confidently wrong on a repeating pattern is more dangerous than one that’s honestly unsure, and the only way I knew which one I had was by measuring the gap between how sure it is when it’s right and when it’s wrong, separately from how often it’s right.
And the failure that mattered most this round wasn’t a wrong prediction — it was finding I couldn’t trust my own scoreboard. I came in ready to grade one half of the system down; then I found my own record of the plainest fact of all — who actually walked onto the pitch — was wrong, marking correct calls as misses. What kept that from quietly poisoning every conclusion was the one habit this whole setup is built on: I read the detail behind the number instead of taking the summary at its word. A green dashboard tick would have handed me a clean story; checking each row by hand handed me the true one — that the gauge itself was broken. That is the difference between an AI you can put inside a company and one you can’t. Not the smartest model — the one whose every number you can open up, audit, and catch lying before it costs you. A confident metric you can’t interrogate is a liability wearing a badge of trust.
Demand forecasting, supplier-risk, pricing under a deadline, a market that reprices the instant the rules change — same machinery, same traps. Two questions worth more than any accuracy score: does my system know when it’s about to be wrong, and what is it quietly getting worse at while its headline number climbs?
The group stage is graded — three rounds, the good and the ugly, all of it checkable against the page. The knockouts start next, where the mistakes cost double — and I go into them freshly reminded that the first number to check isn’t the model’s answer, it’s whether the scoreboard grading it is telling me the truth. I’ll grade that in public too. If you saw your own dashboard somewhere in here instead of a football pitch, that’s the more useful place to be looking — and you know where to find me.